Three Strategies to Improve Fleet Maintenance Cost – Trucks Roll, Ep. 14
How can tracking data help me make better fleet decisions?
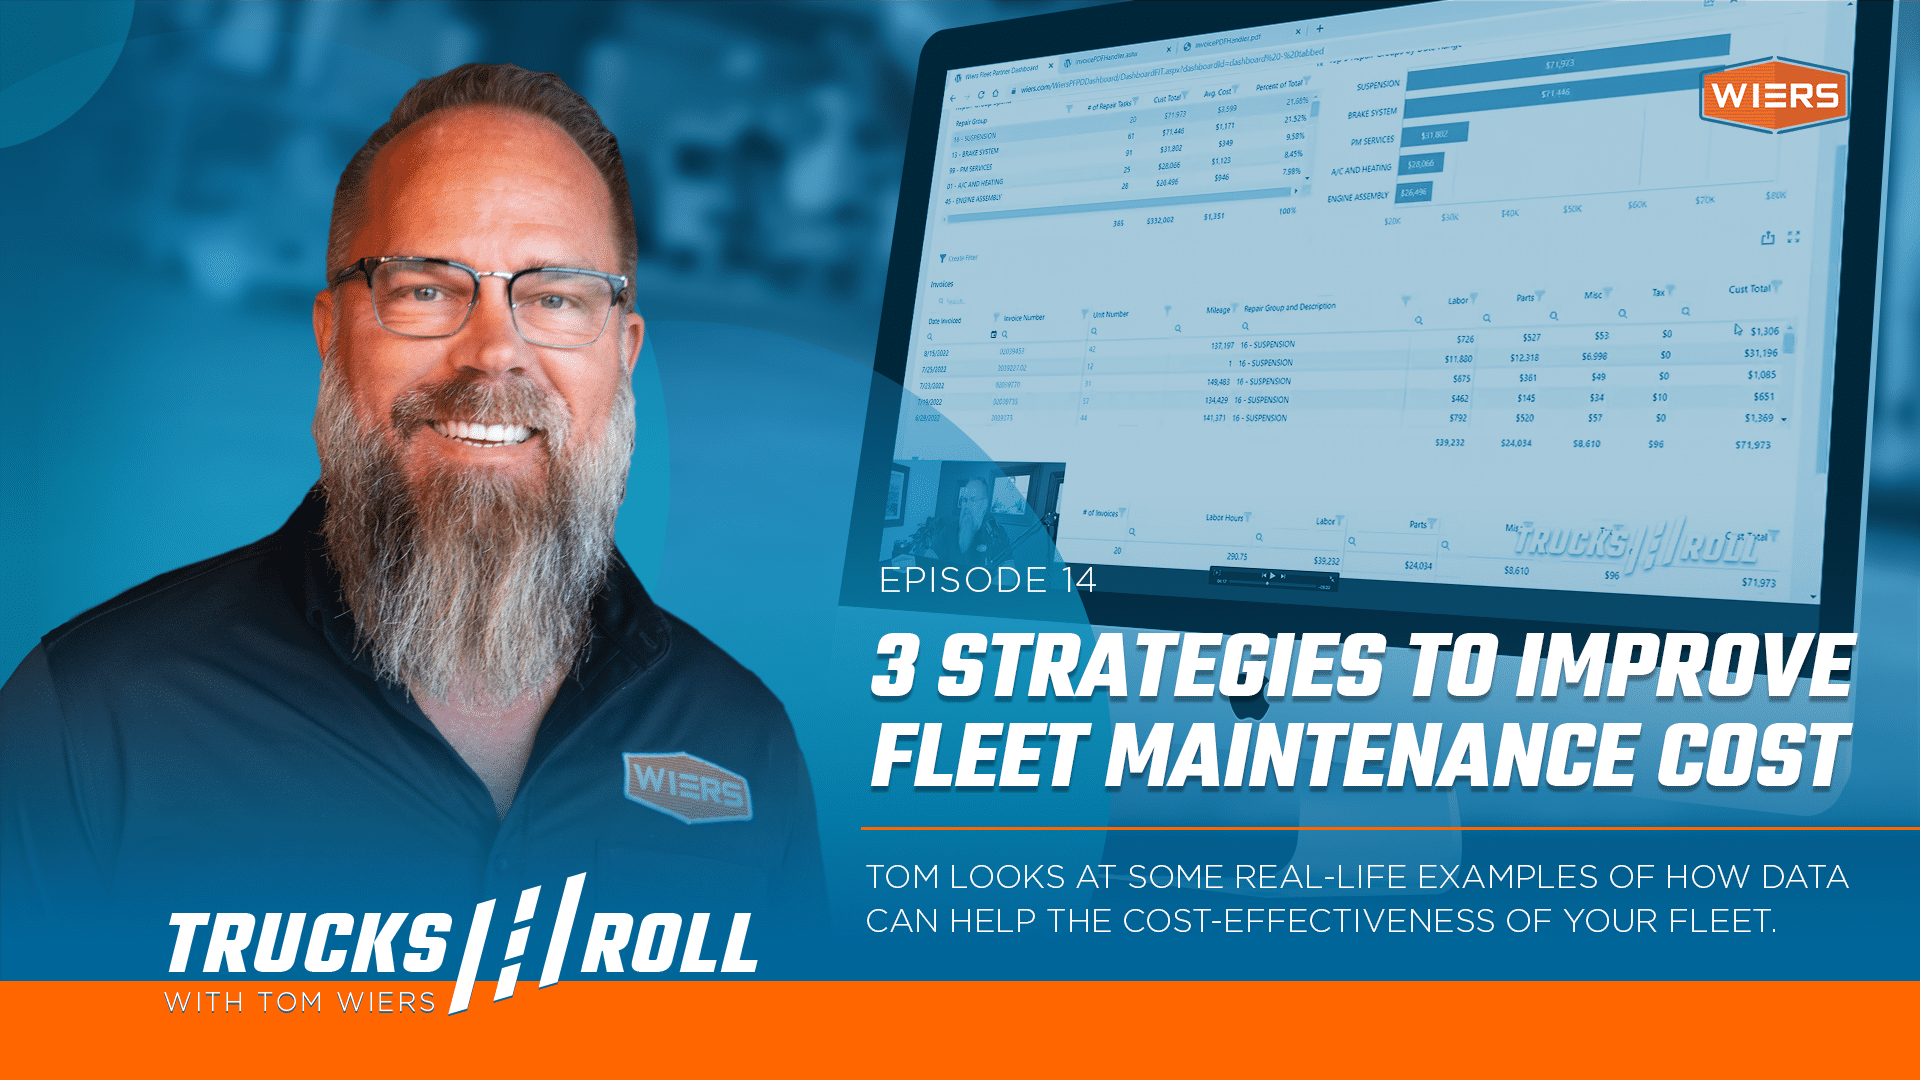
In this episode of the Trucks Roll Podcast, Tom shares some real-life examples from the Wiers Partner Dashboard of how data can help improve fleet maintenance costs.
In this episode, you’ll learn the value of:
- Capturing & Tracking Data
- Things to think about when analyzing the data you’ve collected
- And how this data can help you make better decisions about your fleet.
If you’re looking for a way to better understand your fleet and the processes involved with a good maintenance plan, one of our staff would love to talk to you about how Wiers can help.
Check out our fleet partnership plans page to find out more.
Here is the transcript for Trucks Roll Ep. 14:
Welcome to the Trucks Roll podcast. I’m Tom Wiers. And today, I’d like to talk to you about three strategies to improve fleet maintenance costs. What we’re going to do today is I’m going to use some real life data out of our Fleet Partner Dashboard about the importance of capturing data, analyzing data, and then using that data to make a better decision going forward.
We’re going to jump right in here to our fleet partner dashboard. And the first thing I’m going to do is bring up a customer with over 40 units and about an annual spend over $300,000, which we would all agree is a tremendous amount of cost to run a fleet. With over 40 units, that’s about $7,000 per truck. And this particular customer has an off road application. So we would expect to see a little bit higher cost given that on-road/off-road situation. Now, for some of you, you know, understanding what data to capture, how do you go about that? This will be very helpful if you have a system, a computer system, some sort of software package, that’s by far the best way to go at Wiers,
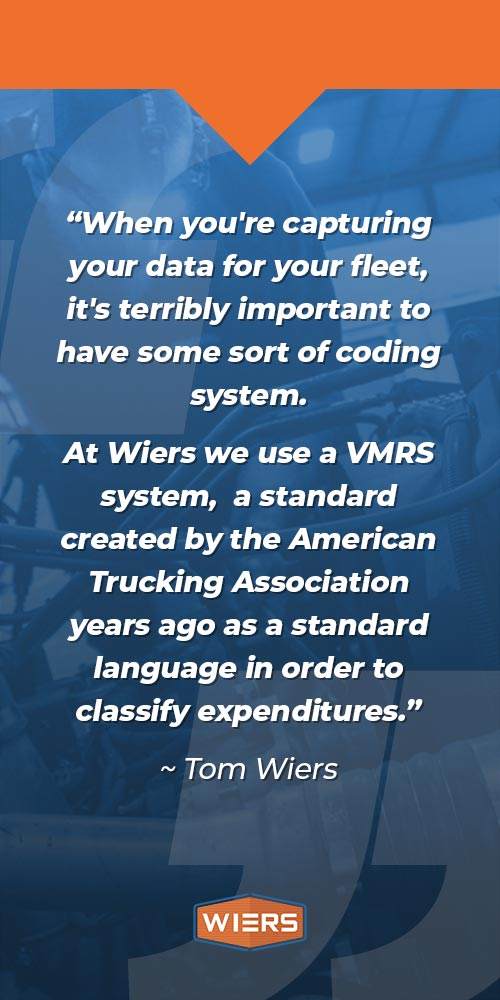
Our customers, our fleet partners, our customers are on a dashboard system. And, you know, this is where we can give fleet list information, PM, DOT status unit spans. And also today what we talk mostly about is the repair group. The capturing the data isn’t terribly important. So let’s look at repair groups and what I want to point out here. When you’re capturing your data for your fleet, it’s terribly important to have some sort of coding system. In our particular situation, we use a VMRS, and this is a standard created by the American Trucking Association years and years ago where fleets of adopted essentially a standard language in order to classify expenditures.
And as an example here, if you see 16 to judge code, sometimes they’ll be four digit code or even longer. But for simplicity’s sake, we use a two digit code that represents suspensions. And then of course, 13 is for brakes and 99 for PMs. So what this allows you to do is over time you can classify your expenditures not only by unit but also by system. And so it’s terribly, it’s terribly valuable to look at the unit and what you’re spending on a per unit basis. But a lot of times it’s actually looking at the repair systems where the data will help you identify opportunities for improvement.
And for example, it might be that your PMs aren’t appropriate for your application or your use, and we’re going to look a little bit of that today, in fact. So we’re looking at repair group data. And what I like to do and this again, this is that customer with over 40 trucks. What we see here, the data is showing us that over the last 12 months, we’ve spent almost $72,000 in suspensions, just a little bit under that in break work and then $32,000 in preventive maintenance. So at Wiers Fleet Partners we’re always wanting the PM service that 99 category to be at the top of list if at all possible.
So that tells us that we’re investing in PMs and it’s helping drive and manage the rest of the cost. PMs are generally pretty expensive oil filters, those sorts of things. When you get into suspensions, brakes, engines, now you’re talking with a whole different cost category. Higher skilled labor, parts are very expensive, especially in this environment where they’re hard to get. So not only have the cost, but you have the downtime waiting for parts and those sorts of things for larger repairs. Now we have some data and we’re can start to analyze it.
And what I want to do is I want to look at suspension and what is driving that higher cost for this particular fleet in this in this period of time, which is basically last 12 months. And when I click on it. I can see, we’re using the dashboard or fleet partner dashboard, that we had one particular repair that was $31,000, which is obviously quite high considering the others are thousand, $1500, those sorts of ranges. And if I click on the invoice, I can now begin to analyze what’s going on with that particular repair.
So again, the the code and the classification allows me to dig a little deeper. And what you’re going to find on this particular unit, I’ve done some done some of the pre-work on here, but this unit was actually involved in an accident. And so when we look into this, it’s terribly important that, you know, we understand what’s driving these costs. This isn’t something that happened as a you know, just a typical failure. This this unit was obviously in an accident. And one of the things you’d want to do when you’re setting up your own fleet maintenance tracking system is understand how you’re going to classify accidents.
Is that something that you’re going to include in your maintenance data or exclude. You might include it if it’s cost coming out of your company’s budget, if the customer or not the customer excuse me, but if there are other parties responsible, you may not want to include it if they’re writing the check for the repair. But so here we see a pretty, pretty quickly that this is an extensive front suspension, not because of some sort of lack of maintenance or product failure, but because it was involved in a pretty severe accident. So, you know, that that tells us a lot. And we may just that may be enough for right now and say we we don’t have a problem with suspensions because it’s just an accident situation.
But let’s take a look at the next group. They’re going to find some additional information out here. When we look at brake systems, again, this is number 13. And I’m going to classify my rank order. And again, I’m going to see that there’s one this $12,000 invoice. And I want to take a look at that. Is there anything that will tell me the causes the customer states, “He sees metal shavings, front brakes and they’re locked up” and that or that’s the complaint. And then the causes get into kingpins, rotors, brakes, shoes, calipers, those sorts of things.
And there is a very extensive story written here by the technician explaining everything, all the work that was done. And it looks to be, quite honestly, that this could be a maintenance item. The inner pads, the first thing that kind of tips me off here, stuff on the right caliper overextended and inner pad missing, check the remainder of the brakes and find that they are at the minimum thickness. And then it goes on to say that the kingpins had excess supply. So here we have brake pads at the thinnest possible thickness, and we have kingpins, which are our critical suspension components, keeping the front wheel stabilized and such, and they have excess supply.
So the next thing I would do is I would look at them, the mileage on this particular truck. And if I go up in the repair order, I’m going to see that this unit has 133,000 miles.
Now, it is an -offroad application, as I said earlier. Going to be a more severe service. Going to have higher cost, higher wears. But it is suspect, you know, with the proper preventive maintenance. Is it possible to extend that life and reduce these failures? It’s unknowable necessarily from this data, but it does give me something to think about. And one of the things I would be thinking about is looking at other information, looking for other failures that might be related to preventive maintenance.
And it’s not necessarily the preventive maintenance they’re doing isn’t good. It could be that the preventive maintenance is just not happening as often as it needs to, given the application. Or perhaps we need to add different inspection points between preventive maintenance to identify problems before they come, you know, excessively expensive being able to do this. You know, I think this gives you an example of how you can look at the information, capture the information, analyze it, and then start making better decisions to do so. When you capturing data, one thing I also want to point out is it takes time.
You really have to have at least a year’s worth of data in your fleet in order to start getting some trends in analyzing information and start making decisions. If you haven’t already started that, I really encourage you to do so. And if you simply don’t have the capacity or personnel in order to do this internally, you can’t outsource it. I mean, a lot of customers outsource to us for this particular reason. Not only do they get the preventive maintenance and repairs that they need, but they also get information to help them make better decisions, reduce their downtime. Again, it’s not only just the cost, their safety implications.
There’s compliance implications. There’s customer satisfaction, driver satisfaction. So when we’re talking about doing this, capturing, analyzing, making better decisions, it’s touching a lot of facets of the business beyond just the checkbook.
I hope you’ve enjoyed this podcast on three ways to improve your fleet maintenance. If you’d like to learn more, please go to wiers.com. We have a page on our fleet partnership plans that give you detailed information. And one of our representatives would be happy to walk you through that.
Thanks. And Trucks Roll.
Links:
- Share your thoughts and connect with us on Facebook
- Check out more videos on Youtube
- Listen to Previous Episode
